<!--
* @Author: pink
* @Date: 2024-03-09 17:09:18
* @LastEditors: pink
* @LastEditTime: 2024-03-11 15:14:48
* @Description:
-->
<template>
<div class="box">
<div class="box-title">
<span></span>
</div>
<div class="box-content">
<div class="tableBox">
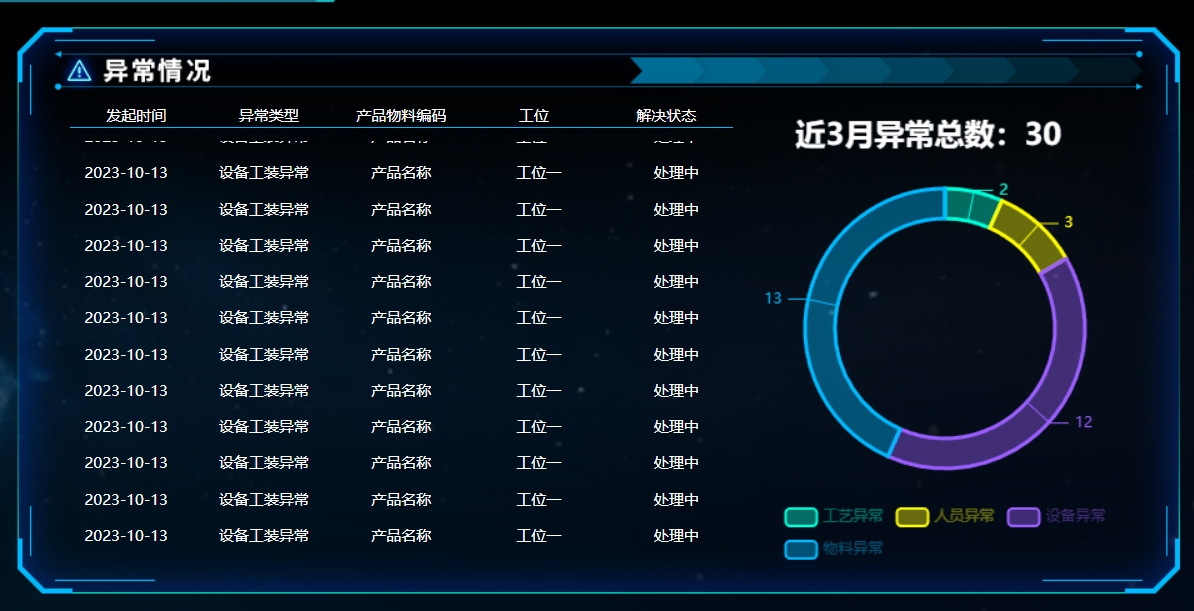
<div class="tableTitleBox">
<div class="head-l1">发起时间</div>
<div class="head-l2">异常类型</div>
<div class="head-l3">产品物料编码</div>
<div class="head-l4">工位</div>
<div class="head-l5">解决状态</div>
</div>
<!-- 滚动列表区域 -->
<div class="tatleList" id="table">
<div id="list1">
<div
class="tableContentBox"
v-for="el in productionList"
:key="el.name"
>
<div class="content-l1">{{ el.data }}</div>
<div class="content-l2">{{ el.abnormalType }}</div>
<div class="content-l3">{{ el.materialCode }}</div>
<div class="content-l4">{{ el.workStation }}</div>
<div class="content-l5">{{ el.status }}</div>
</div>
</div>
<div id="list2"></div>
</div>
</div>
<!-- 饼状图 -->
<div id="pieMain" class="pie-box"></div>
</div>
</div>
</template>
<script setup>
import { onMounted, onUnmounted } from 'vue';
import * as echarts from 'echarts';
onMounted(() => {
handleRoll(100); // 启动定时任务
initChart();
});
onUnmounted(() => {
timer && clearInterval(timer);
});
const productionList = [
{
data: '2023-10-13',
abnormalType: '设备工装异常',
materialCode: '产品名称',
workStation: '工位一',
status: '处理中',
},
{
data: '2023-10-13',
abnormalType: '设备工装异常',
materialCode: '产品名称',
workStation: '工位一',
status: '处理中',
},
{
data: '2023-10-13',
abnormalType: '设备工装异常',
materialCode: '产品名称',
workStation: '工位一',
status: '处理中',
},
{
data: '2023-10-13',
abnormalType: '设备工装异常',
materialCode: '产品名称',
workStation: '工位一',
status: '处理中',
},
{
data: '2023-10-13',
abnormalType: '设备工装异常',
materialCode: '产品名称',
workStation: '工位一',
status: '处理中',
},
{
data: '2023-10-13',
abnormalType: '设备工装异常',
materialCode: '产品名称',
workStation: '工位一',
status: '处理中',
},
{
data: '2023-10-13',
abnormalType: '设备工装异常',
materialCode: '产品名称',
workStation: '工位一',
status: '处理中',
},
{
data: '2023-10-13',
abnormalType: '设备工装异常',
materialCode: '产品名称',
workStation: '工位一',
status: '处理中',
},
{
data: '2023-10-13',
abnormalType: '设备工装异常',
materialCode: '产品名称',
workStation: '工位一',
status: '处理中',
},
{
data: '2023-10-13',
abnormalType: '设备工装异常',
materialCode: '产品名称',
workStation: '工位一',
status: '处理中',
},
{
data: '2023-10-13',
abnormalType: '设备工装异常',
materialCode: '产品名称',
workStation: '工位一',
status: '处理中',
},
{
data: '2023-10-13',
abnormalType: '设备工装异常',
materialCode: '产品名称',
workStation: '工位一',
status: '处理中',
},
];
const pieData = {
code: 1,
message: '操作成功!',
data: [
{
electricWheelCode: '工艺异常',
count: 2,
},
{
electricWheelCode: '人员异常',
count: 3,
},
{
electricWheelCode: '设备异常',
count: 12,
},
{
electricWheelCode: '物料异常',
count: 13,
},
],
success: true,
};
let timer;
// 列表数据定时任务
const handleRoll = (t) => {
const div1 = document.getElementById('list1');
const div2 = document.getElementById('list2');
const divBox = document.getElementById('table');
timer = setInterval(() => {
if (div1.offsetHeight > divBox.offsetHeight) {
if (!div2.innerHTML) {
div2.innerHTML = div1.innerHTML; // 添加list2 实现无缝滚动
divBox.scrollTop = 0; // 开始滚动设置为0,负数也为0
}
rollStart();
} else {
div2.innerHTML = null;
}
}, t);
};
// 定时函数
const rollStart = () => {
const div1 = document.getElementById('list1');
const divBox = document.getElementById('table');
if (divBox.scrollTop >= div1.scrollHeight) {
// scrollTop 元素滚动条内的顶部隐藏部分的高度; scrollHeight 元素滚动条内的内容高度; 如果设置scrollTop的值超出了这个容器滚动的值,则scrollTop的值为容器最大值
divBox.scrollTop = 0;
} else {
divBox.scrollTop += 1; // 每次滚动条顶部部分加1
}
};
const initChart = () => {
const myChart = echarts.init(document.getElementById('pieMain'));
let dataList =
pieData?.data?.map((x) => ({
name: x.electricWheelCode,
value: x.count,
})) || [];
let colorList = [
'rgba(0, 255, 216, 0.4)',
'rgba(255, 252, 0, 0.4)',
'rgba(155,94,255,0.4)',
'rgba(0,186,255,0.4)',
];
let borderColor = ['#00ffd8', '#fffc00', '#9b5eff', '#00baff'];
const option = {
title: {
text: '近3月异常总数:30',
right: 62,
top: 20,
textStyle: {
color: '#ffffff',
fontSize: '24px',
},
},
legend: {
top: 'bottom',
textStyle: {
color: borderColor,
},
},
series: [
{
type: 'pie',
radius: ['70%', '55%'],
center: ['50%', '50%'],
color: colorList,
label: {
show: true,
formatter(param) {
return param.value;
},
},
data: dataList.map((item, index) => {
item.label = {
// 第一种方法
color: borderColor[index],
};
item.labelLine = {
// 改变标示线的颜色
normal: {
// 改变标示线的长度
length: 25,
lineStyle: {
color: borderColor[index], // 改变标示线的颜色
},
},
};
item.itemStyle = {
borderWidth: 3,
borderColor: borderColor[index],
};
return item;
}),
},
],
};
myChart.setOption(option);
};
</script>
<style lang="less" scoped>
.box {
padding: 10px 30px;
box-sizing: border-box;
width: 930px;
height: 453px;
.box-title {
width: 870px;
height: 31px;
}
.box-content {
width: 870px;
margin-top: 10px;
display: flex;
flex-wrap: wrap;
.tableBox {
width: 550px;
height: 390px;
font-family: MicrosoftYaHei;
font-size: 12px;
color: #ffffff;
text-align: center;
.tableTitleBox {
font-size: 12px;
border-bottom: 1px solid #00baff;
display: flex;
font-family: MicrosoftYaHei;
color: #ffffff;
margin: 10px;
.head-l1 {
width: 20%;
}
.head-l2 {
width: 20%;
}
.head-l3 {
width: 20%;
}
.head-l4 {
width: 20%;
}
.head-l5 {
width: 20%;
}
}
.tatleList {
height: 322px;
width: 550px;
overflow: hidden;
}
.tableContentBox {
height: 13px;
width: 550px;
display: flex;
padding: 8px 0px;
.content-l1 {
width: 20%;
}
.content-l2 {
width: 20%;
}
.content-l3 {
width: 20%;
}
.content-l4 {
width: 20%;
}
.content-l5 {
width: 20%;
}
}
}
.pie-box {
height: 380px;
width: 320px;
}
}
}
</style>


https://shorturl.fm/qggUy
https://shorturl.fm/8YWJJ
https://shorturl.fm/ngSHs
https://shorturl.fm/wnrtA
https://shorturl.fm/OiF0P
https://shorturl.fm/MBKfV
https://shorturl.fm/vYD1o
https://shorturl.fm/k17iJ
https://shorturl.fm/sJM1N
https://shorturl.fm/bNPao
https://shorturl.fm/jE9gI
https://shorturl.fm/eTk3l
https://shorturl.fm/HDndu
https://shorturl.fm/kJ53h
https://shorturl.fm/S4mNo